Overview
The lab looks at three pieces of the music income puzzle: merch profitability, streaming monetization, and how many streams are required to break even against a real cost-of-living target.
1) Merchandise Profitability
This table compares production cost, retail price, and profit per unit for each merch item. The chart below highlights which product generates the most profit per sale.
| Item | Production Cost | Retail Price | Margin % | Profit per Unit | Gross Profit per Unit |
|---|---|---|---|---|---|
| T-Shirt | $9.05 | $30.00 | 68.17% | $20.45 | $20.95 |
| Vinyl LP | $14.25 | $31.00 | 45.97% | $14.25 | $16.75 |
| Hoodie | $23.60 | $60.00 | 57.33% | $34.40 | $36.40 |
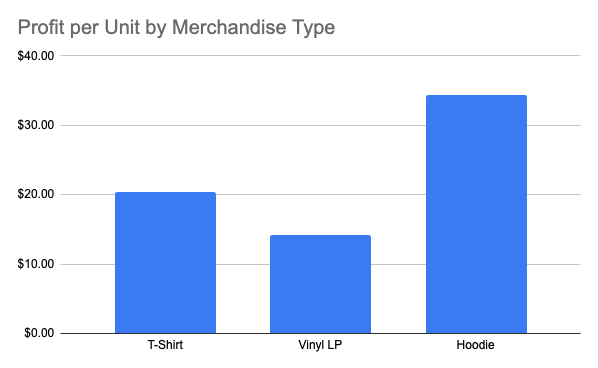 Bar chart: Profit per Unit by Merchandise Type
Hoodies generate the highest profit per unit, while vinyl records produce the lowest return per sale.
2) Streaming CPM and Estimated Earnings
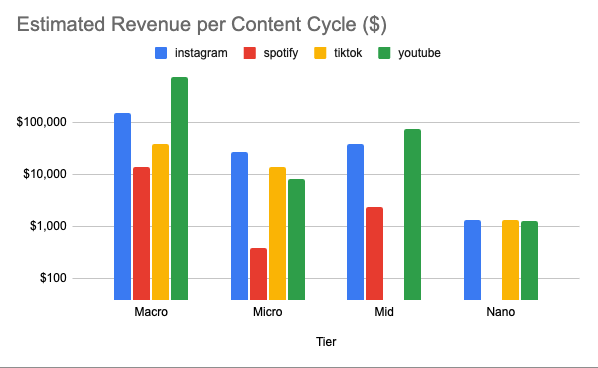
This table combines audience tier, platform CPM, and estimated earnings based on the LA break-even target. The chart below shows how platform monetization changes across tiers.
| Tier | Platform | CPM Low | CPM High | CPM Mid | Views Low | Views High |
|---|---|---|---|---|---|---|
| Nano | 10 | 200 | 105 | 5,000 | 20,000 | |
| Nano | spotify | 2.5 | 3.5 | 3 | 5,000 | 20,000 |
| Nano | tiktok | 10 | 200 | 105 | 5,000 | 20,000 |
| Nano | youtube | 5 | 200 | 102.5 | 5,000 | 20,000 |
| Micro | 5 | 500 | 252.5 | 20,000 | 200,000 | |
| Micro | spotify | 3 | 4 | 3.5 | 20,000 | 200,000 |
| Micro | tiktok | 5 | 250 | 127.5 | 20,000 | 200,000 |
| Micro | youtube | 2 | 150 | 76 | 20,000 | 200,000 |
| Mid | 5 | 125 | 65 | 200,000 | 1,000,000 | |
| Mid | spotify | 3.5 | 4.5 | 4 | 200,000 | 1,000,000 |
| Mid | tiktok | 0 | 200,000 | 1,000,000 | ||
| Mid | youtube | 5 | 250 | 127.5 | 200,000 | 1,000,000 |
| Macro | 2 | 100 | 51 | 1,000,000 | 5,000,000 | |
| Macro | spotify | 4 | 5.5 | 4.75 | 1,000,000 | 5,000,000 |
| Macro | tiktok | 1 | 25 | 13 | 1,000,000 | 5,000,000 |
| Macro | youtube | 5 | 500 | 252.5 | 1,000,000 | 5,000,000 |
 Grouped bar chart: Streams Needed to Meet LA Cost of Living by Platform and Tier
Streaming revenue requirements vary dramatically by platform, with Spotify requiring far more streams than the other platforms to reach the same income target. Estimated revenue calculated using the formula: Income = (Total Views / 1000) × CPM (mid).
3) Streaming Survival Break-Even
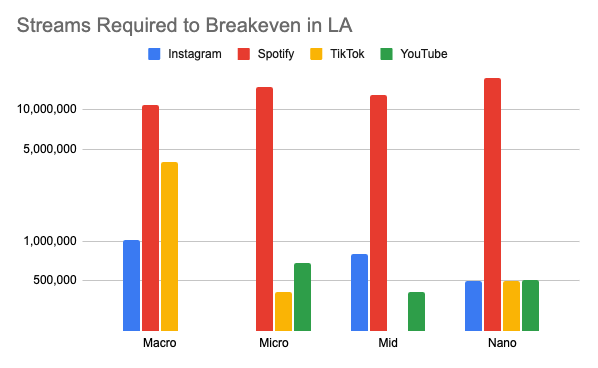
This table focuses on the combined question of whether streaming can cover the cost of living in Los Angeles. It uses the same raw income target and platform CPM data to estimate break-even volume.
| Tier | Instagram CPM | Spotify CPM | TikTok CPM | YouTube CPM | Instagram Streams Needed (LA) | Spotify Streams Needed (LA) | TikTok Streams Needed (LA) | YouTube Streams Needed (LA) |
|---|---|---|---|---|---|---|---|---|
| Nano | 105 | 3 | 105 | 102.5 | 493,705 | 17,279,667 | 493,705 | 505,746 |
| Micro | 252.5 | 3.5 | 127.5 | 76 | 205,303 | 14,811,143 | 406,580 | 682,092 |
| Mid | 65 | 4 | 0 | 127.5 | 797,523 | 12,959,750 | 0 | 406,580 |
| Macro | 51 | 4.75 | 13 | 252.5 | 1,016,451 | 10,913,474 | 3,987,615 | 205,303 |
 Log-scale bar chart: Streams Required to Break Even in Los Angeles
Even at higher audience tiers, streaming alone requires millions of plays on lower-paying platforms, showing how difficult it is to rely on a single income source.