
The research described on this page is a deep dive into available data analytics on early-stage breast cancer detection. As you explore this page, you'll see that by focusing not just on cancer incidence alone, but on stage of detection segmented by demographics, survival outcomes could be improved by placing more focus and investment on increased screening access in underserved areas.
Incidence of Breast Cancer
Stage at Diagnosis (0, I, II, III, IV)
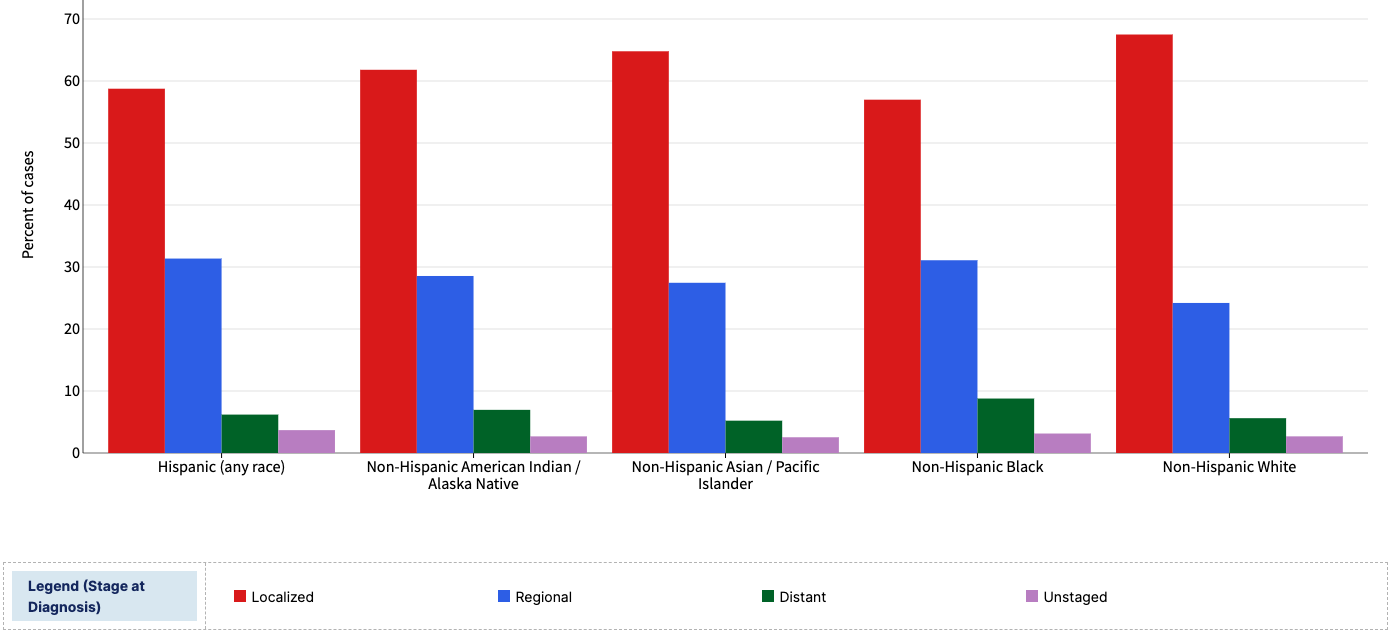
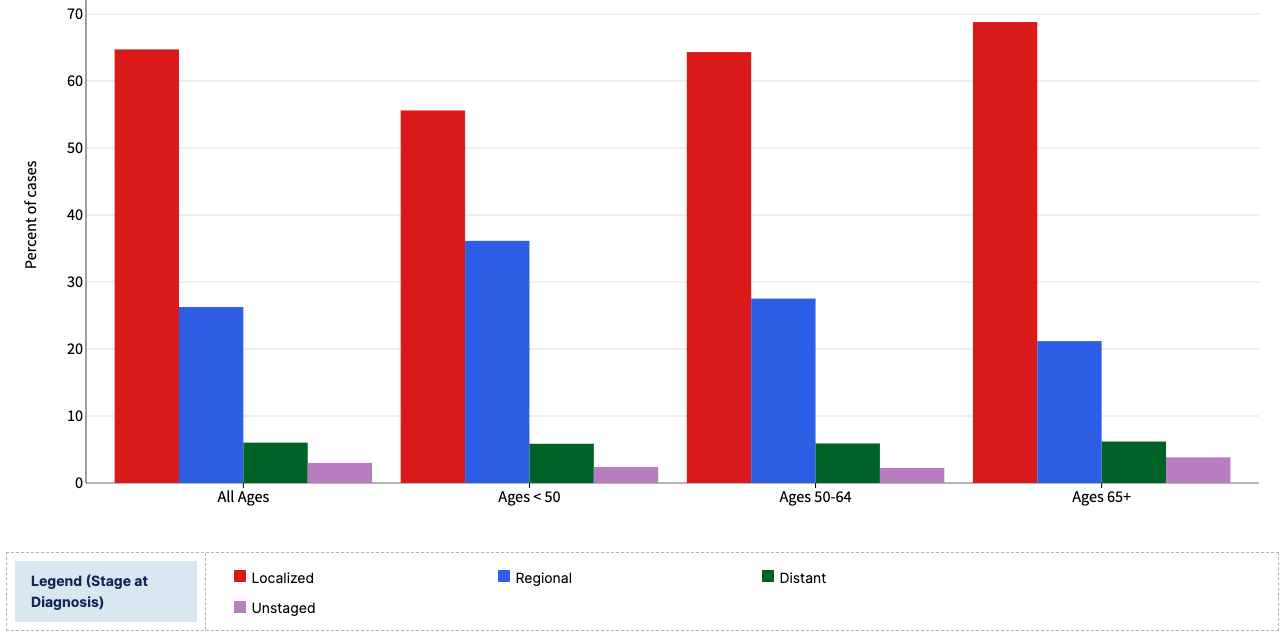
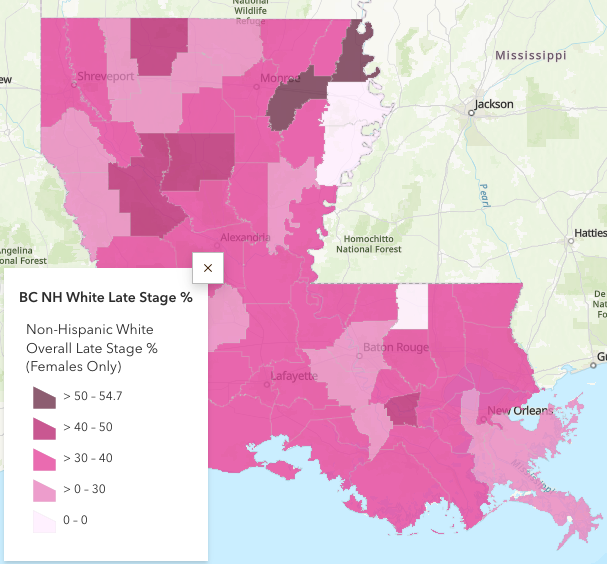
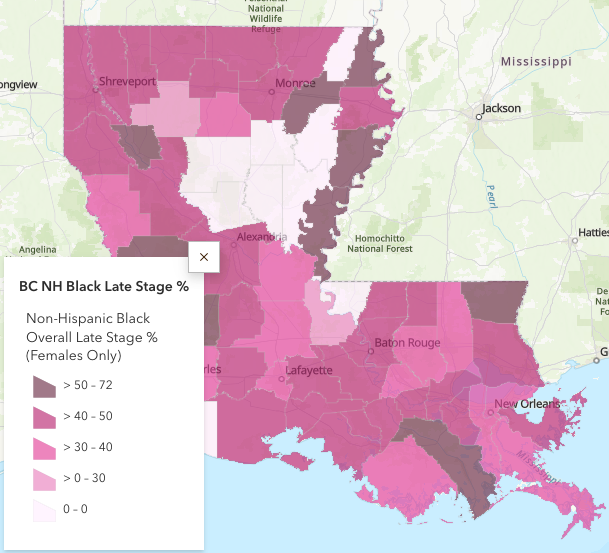
Demographic Disparities in Early-Stage Detection


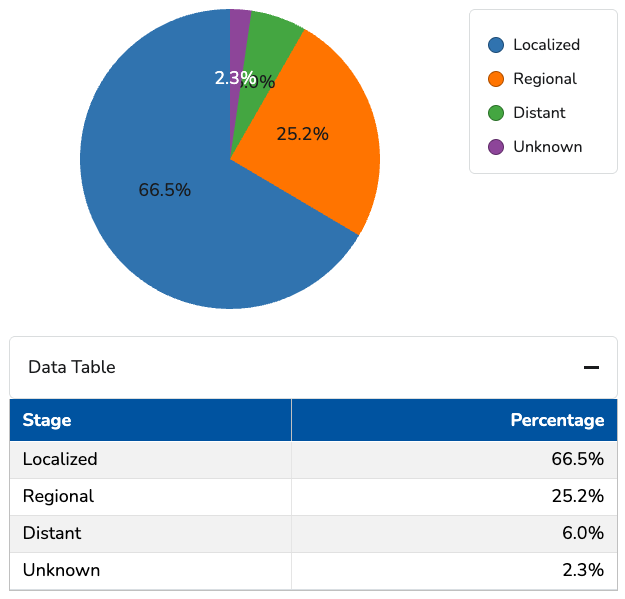
From 2018 to 2022, about 2 in 3 female breast cancer cases were diagnosed at a localized stage, meaning the cancer had not spread outside the breast. About 1 in 4 female breast cancers were found at a regional stage (the cancer had spread to nearby lymph nodes, tissues, or organs), and 6% were found at a distant stage (the cancer had spread to distant parts of the body).

These action items highlight the need for visualization tools that not only describe disparities, but actively support exploration, prioritization, and intervention.
Available data can address screening disparities in under-detected populations by identifying who is being detected late and where they might be located. Policymakers and institutions should deploy targeted screening programs rather than replying on standard national screening recommendations.
Supplementing national metrics with “equity indicators” like minimum screening rates changes early-detection success criteria focus from performance average to missing demographics.
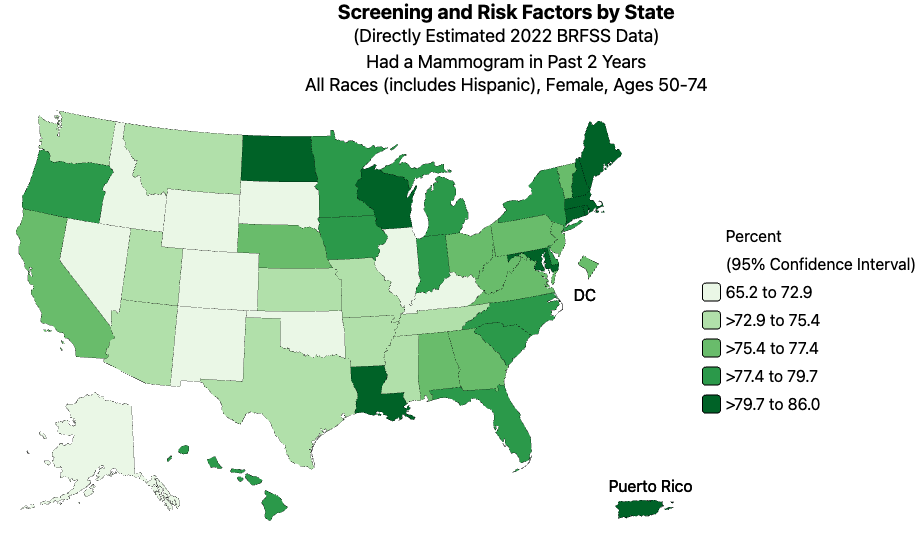
Screening maps identify where gaps exist, and stage-at-diagnosis data shows consequences of those gaps. Funding and infrastructure should be allocated to regions with low screening and high late-stage diagnosis rates.
A greater variety of tools are needed that enable viewers to explore early-stage detection by:
Instead of static charts, users can identify populations with layered disadvantage.
By visualizing access and outcomes geographically, intervention resources can be allocated in high-risk zones.
Health Administrators and Policymakers can ask equity-focused questions of the data to address accountability issues.
All logos and images used in this document are sourced from their respective organizations and are used here for illustrative purposes only.